Highlighted Features of Data Analysis Software FlexPro®
Obtain reliable results quickly with FlexPro®, the convenient measured data analysis tool that offers sophisticated features and numerous intelligent functions.
Superior Performance and User Convenience
FlexPro® combines the superior functionality of a technical software product with the convenience of an office application.
- Take advantage of all the conveniences offered by the FlexPro® 2021 ribbon user interface.
- Keep track of your data with FlexPro®’s practical preview feature.
- FlexPro® Professional lets you take full advantage of the power of your multicore CPU.
- Continue while FlexPro® calculates your evaluations in the background.

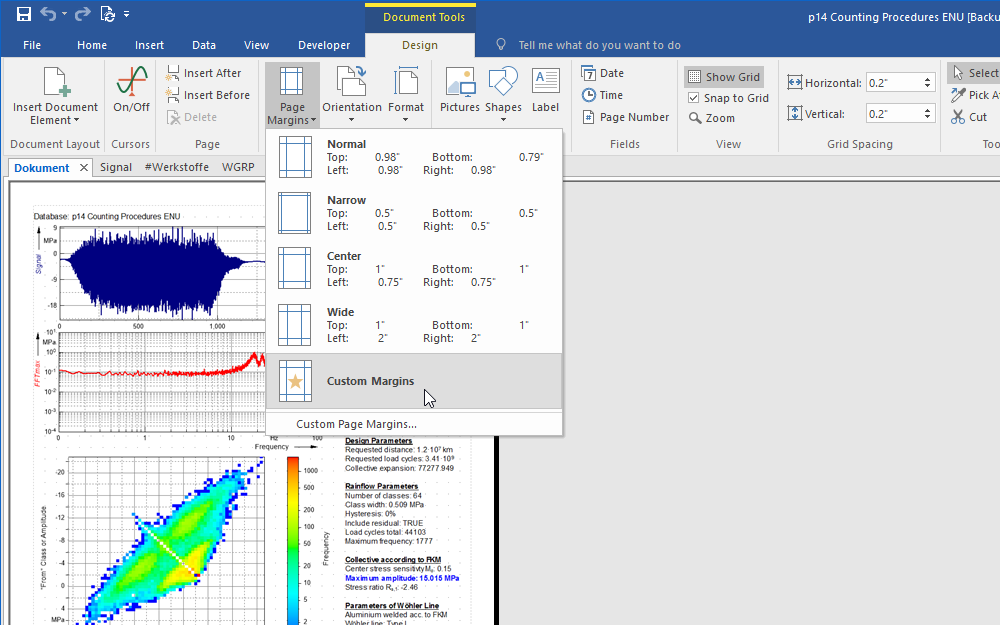
The Microsoft Office-like layout helps you quickly find your way around.
Many file formats and sources – one analysis tool
No matter which measuring device, measurement hardware or acquisition software you use, FlexPro® makes organizing data extremely easy.
- Clearly and reliably organize your data and analyses in FlexPro® Explorer.
- Use FlexPro® to combine data from a wide range of different sources and process the data in a central location.
- Store large volumes of data in the FlexPro® project database, limited only by the space on your hard disk.
- Use the index-based search to quickly find the data you want to analyse.
- Export your results in a variety of different binary and graphic formats.

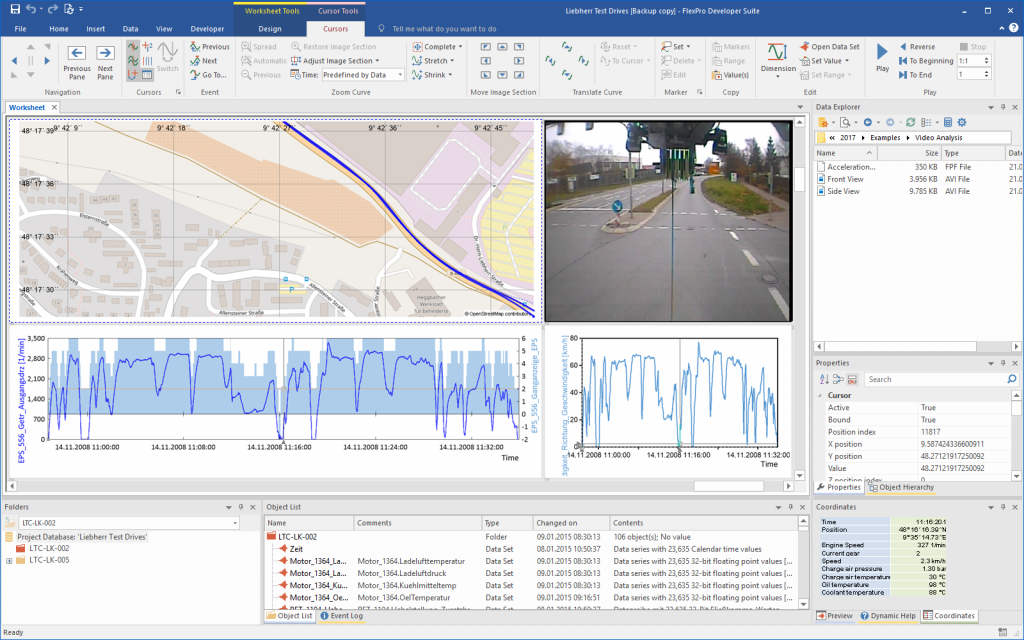
Analyse a road test with GPS, video and measurement data.
Use FlexPro for Analyses – Mathematics Can Be That Easy!
FlexPro® helps you quickly get results from raw data.
- In clear galleries you will find a variety of procedures from science and technology.
- Develop your own analysis algorithms in FPScript, giving you access to over 300 functions.
- Calculate directly with physical quantities composed of value and unit. The FlexPro® SI Unit Manager ensures the correct interpretation and adjustment of the units.

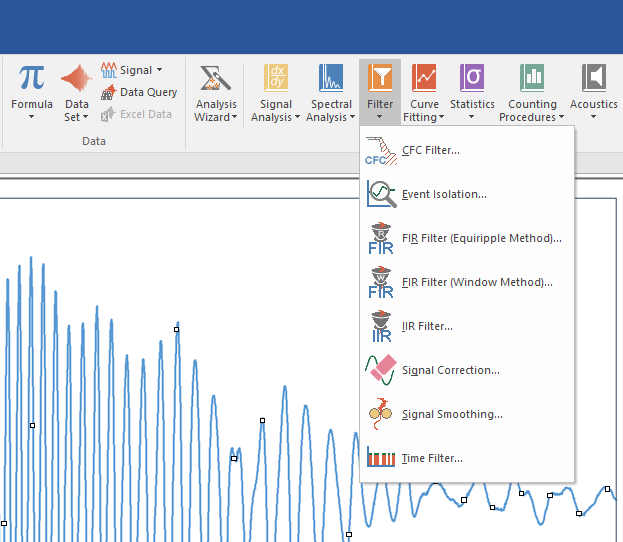
Whether working on projects requiring spectral analysis, filters or curve fitting, simply select data and choose your analysis.
Present Results That Impress
Use FlexPro®’s wide range of presentation and style options to highlight the essentials in your analyses.
- Choose from a variety of diagram and table styles from clearly arranged galleries.
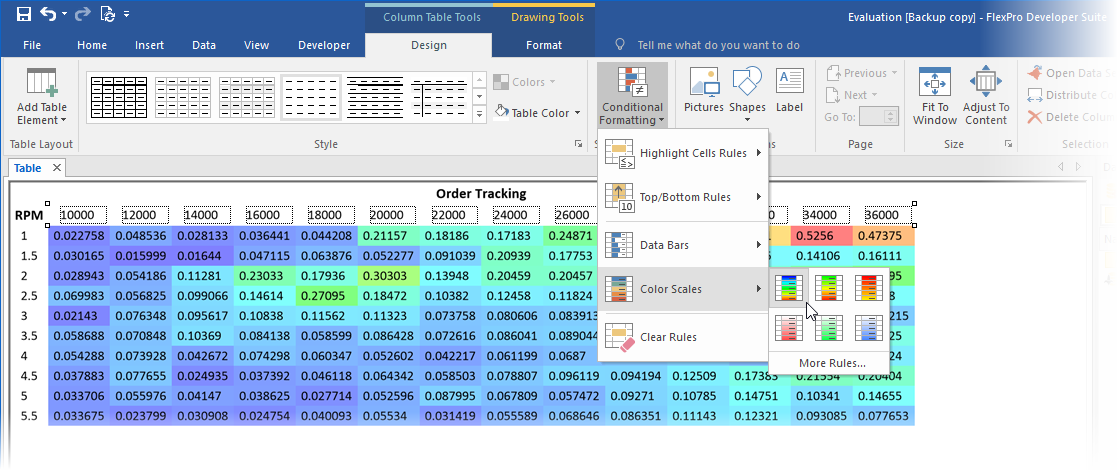
- Improve the readability of tables by using conditional highlighting and data bars.
- Combine measurement data with map displays and videos to optimally cover a road test, for instance.

For more information, please see the product page here.

