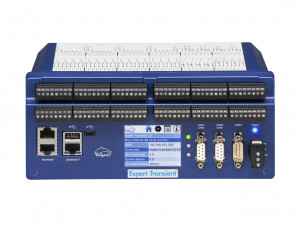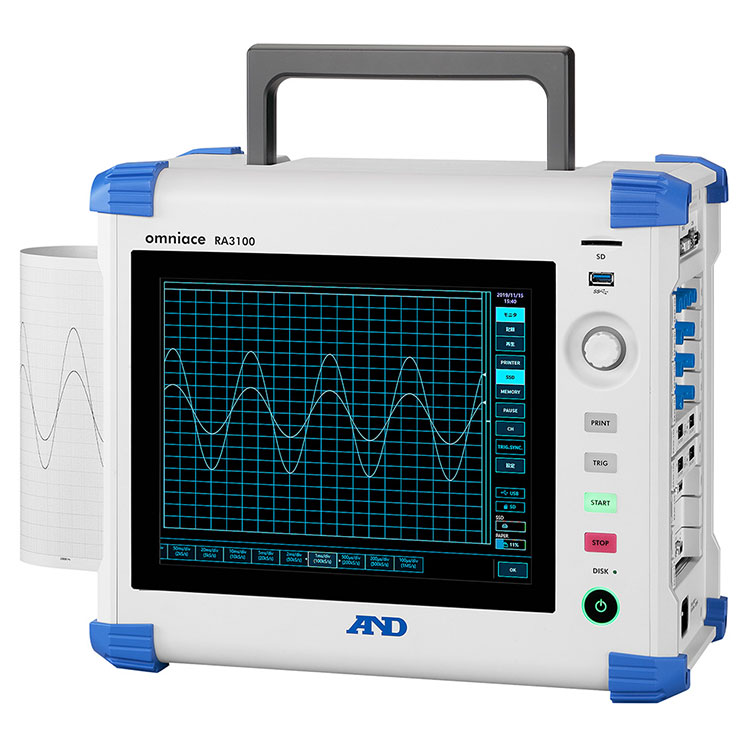
RA3100 Thermal Chart Recorder / Portable DAQ System from A&D.
The RA3100 accurately records high-speed switching waveforms even in harsh noise environments at research and development sites and maintenance sites for electric vehicles, home appliances, railroad vehicles, solar power generation systems, etc. that use inverter control technology.
Module |
Sampling Rate |
Input |
Specifications |
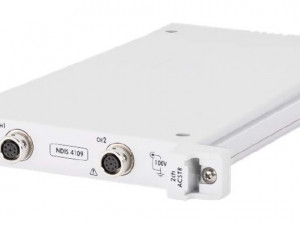
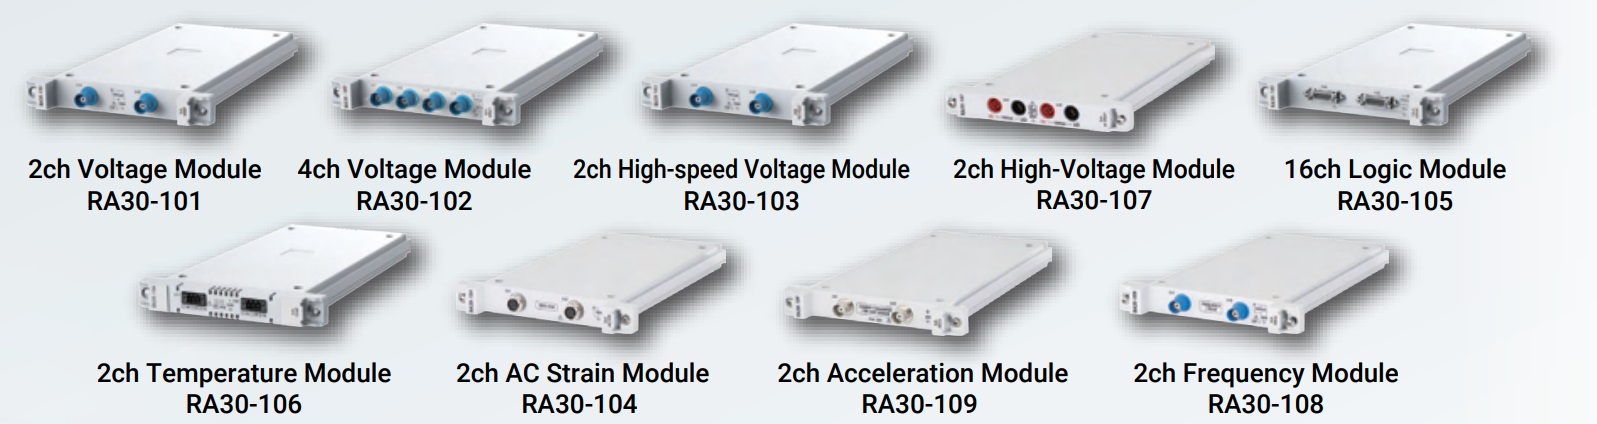
| 2ch Voltage | 1MS/s | Voltage ±500V | Measure high-speed voltage measurement with anti-aliasing filters |
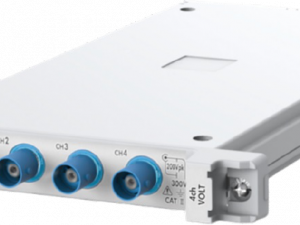
| 4ch Voltage | 1MS/s | Voltage ±200V | Multi-channel voltage measurement |
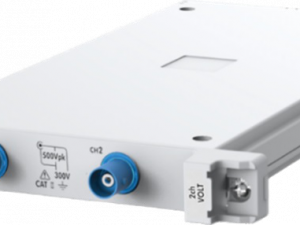
| 2ch High-speed Voltage | 20MS/s | Voltage ±500V | High-speed voltage measurement |
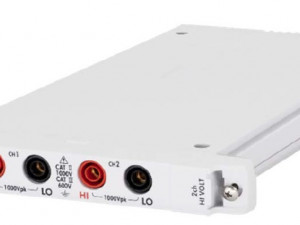
| 2ch High Voltage | 1MS/s | Voltage ±1,000V | Module to measure high voltages of ±1,000V |
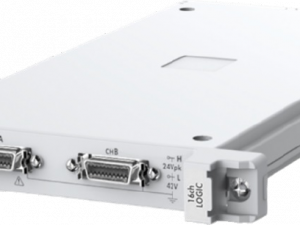
| 16ch Logic | 1MS/s | Contact, Voltage | Contact, Voltage signal measurement |
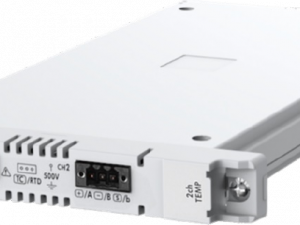
| 2ch Temperature | 1.5ms | Thermocouple : K, E, J, T, N, R, S, B, C RTD: Pt100, Pt1000 |
Measurement of temperature with a thermocouple and RTD |
| 2ch AC Strain | 100kS/s | Strain gauge, Strain gauge transducer | Measures stress, load, displacement, pressure, torque, and acceleration |
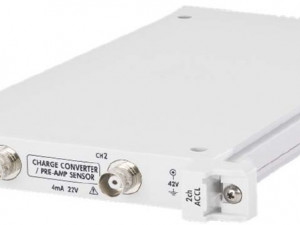
| 2ch Acceleration | 1MS/s | Piezoelectric acceleration transducer (charge output, built-in amplifier) |
Measures acceleration, speed and displacement |
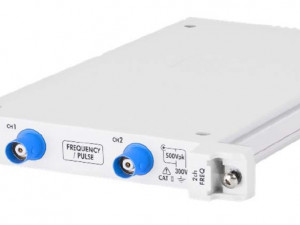
| 2ch Frequency | 1MS/s | Voltage ±500V | Input module capable of measuring period, rotation speed, number of pulses, etc., of input signals |
Available Separately. For more information visit the product pages via the links below:
2ch Voltage Module
4ch Voltage Module
2ch High-speed Voltage Module
2ch High Voltage Module
16-channel Logic Module
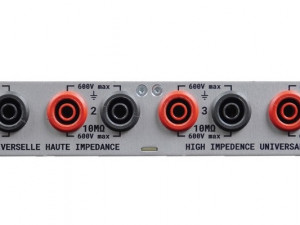
2ch Temperature Module
2ch Frequency Module
2ch AC Strain Module
2ch Acceleration Module
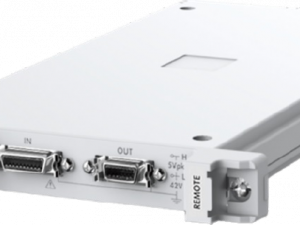
Remote Control Module
Main Specifications |
|
| Display | 12.1-inch TFT colour liquid crystal display (1024 x 768), with capacitive touch panel |
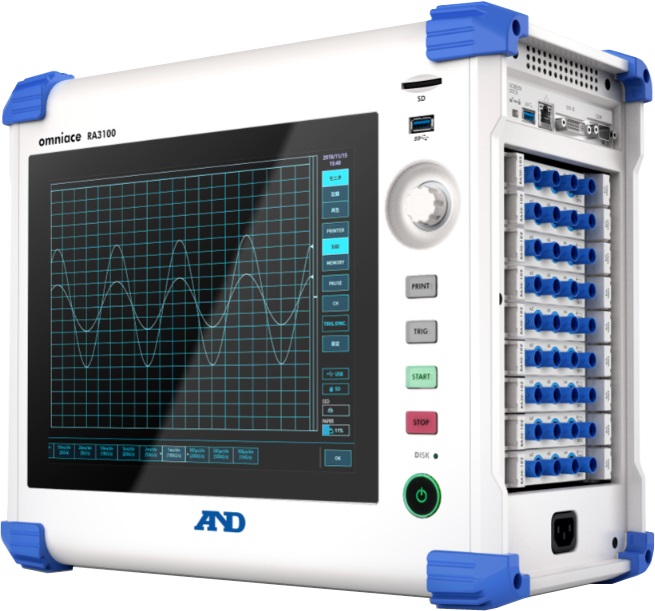
| Channel | Number of module slots: 9 Analogue measurement: Up to 36 channels (when using 4ch voltage module) Logic measurement: Up to 144 channels (when using 16ch logic module) |
| Memory Capacity | 4GB (2G points/ch) |
| Memory Division | 1, 2, 4, 8, 16, 32, 64, 128 split |
| Sampling Speed | Memory recording: 20 MS / s (50 ns) max. to 10S/min SSD recording: 1 MS / s (1 μs) max. to 10S/min |
| Storage Device | SSD (Solid State Drive) 256GB SD card slot, SD / SDHC / SDXC compatible, for storing data after recording USB memory using USB port, for storing data after recording |
| Printer | Thermal recording with thermal head Paper width: 219.5mm Chart Speed: 100mm / s to 1mm / min Effective recording width: Maximum 215mm |
| Printer Functions |
Memory Recording: Record high-speed event recording to memory * *Any combination of memory recording, SSD recording, and printer recording is possible. |
| Trigger | Uses: Trigger for start recording operations, trigger for memory recording Source Channels: Analog/logic signals, manual triggers and external signal triggers of each module Types: Level triggered, window triggered (memory recording triggered ), bit pattern triggered Trigger Filters: Level hold, count Trigger Output: Output signal when trigger conditions are met |
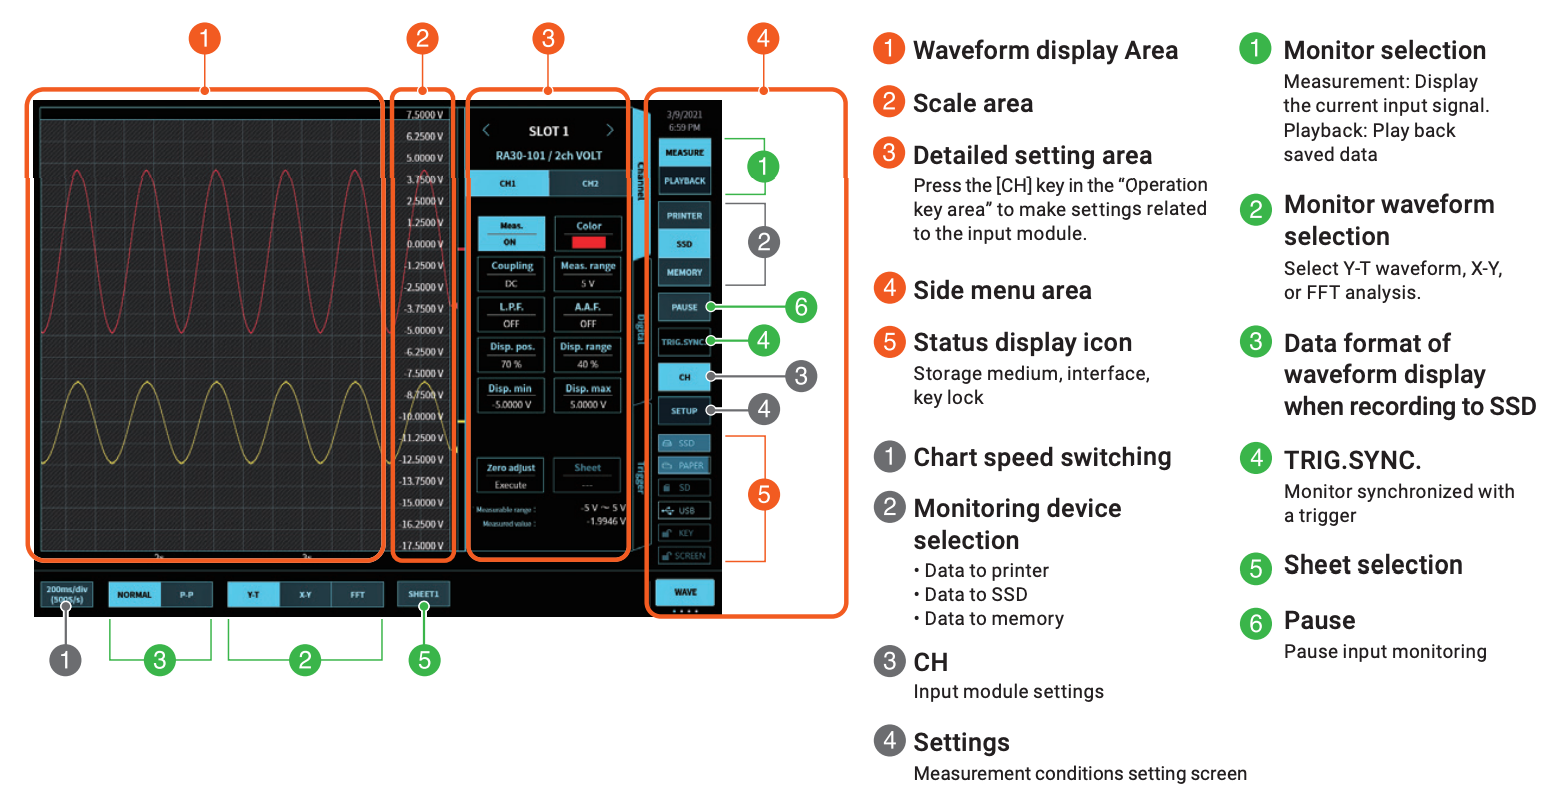
| Monitor | Y-T Waveform Monitor: Display time changes for a measurement signal in a pulse amplitude waveform X-Y Waveform Monitor: Data is plotted with common points, with Signal 1 as the X axis and Signal 2 as the Y axis FFT Analysis Monitor - FFT analysis of the measurement signal of any two channels is performed, and the analysis results are displayed as the frequency axis data. |
Recording and Display |
|
| Y-T Waveform | Displayed Graphs: 1 graph Sheets: Measurement channels are displayed in three sheets, and 48 channels are registered per sheet. Grid: 20 div vertically and 20 div horizontally Time axis Data Count: 100 data/div Chart Paper Resolution: Pulse amplitude axis 8dot/mm, time axis 80dot/mm (at 25mm/s) |
| X-Y Waveform | Data Selection: Select from input signal or recorded data Displayed Graphs: 1 graph, 4 graphs Grid: 20 div vertically and 20 div horizontally Sampling Speed: Max 1KS/s Locas: ON/OFF of locas enabled (pen up& down) Printing: Print the plotted X-Y waveform with the printer |
| FFT Analysis | Data Selection: Select from input signal or recorded data Sampling Points: 1,000, 2,000, 5,000, or 10,000 points Max Analysis Frequency: 1/2.5 times the sampling frequency Displayed Graphs: 1 graph, 2 graphs. The Y-T waveform can also be displayed Graph Types: Waveform in time axis , linear spectrum, RMS spectrum, power spectrum, 1/1 octave, 1/3 octave, Transfer function, cross power spectrum, and coherence function Window Function: Hanning Window Average Processing: Time axis simple addition average, frequency axis simple addition average, frequency axis exponentially weighted average, frequency axis peak hold |
Interface |
|
| LAN | 1000BASE-T (1Gbps): For control with communication command |
| COM | RS-232C: For control by communication command or for UPS shutdown |
| USB | Ver. 3.0 2 port: For storage devices (USB memory) |
| Video Output | DVI-D |
| Operating Environment | Temperature 5 to 40°C Humidity 35 to 80% RH (without condensation) |
| Power Supply | 100 to 240VAC, Frequency 50 to 60Hz Power consumption 300VA or less (under the maximum load conditions) |
| Dimensions | 394 (W) × 336(H) × 200(D) mm *Excluding projections |
| Weight | 9.5kg or less (main body only) 11 kg or less (when main body and four 2-channel voltage modules are installed) |
Available separately.
| No of channels | 2 |
| Input Coupling | AC, DC, and GND coupling |
| Maximum Sampling Speed | 1MS/s |
| Frequency Response (-3dB) | DC to 100kHz |
| A/D Resolution | 16bit |
| Range Accuracy | ±0.3% of RANGE *After offset cancellation |
| Allowable Input Voltage | ±500V (DC or AC peak values) |
| Measurement Range | 100mV to 500V (1-2-5 step) |
| Input Terminals and Models | Insulated BNC connector, insulated unbalanced input, isolation between each channel |
| Input Impedance | 1MΩ |
| Low-Pass Filter | 3, 30, 300, 3k, OFF |
| Anti-Aliasing Filter | 10 to 40kHz |
| Maximum Rated Voltage To Earth | AC, DC300V |
| No of Channels | 4 |
| Input Coupling | DC and GND coupling |
| Maximum Sampling Speed | 1MS/s |
| Frequency Response (-3dB) | DC to 100kHz |
| A/D Resolution | 16bit |
| Range Accuracy | ±0.2% of RANGE *After offset cancellation |
| Allowable Input Voltage | ±200V (DC or AC peak values) |
| Measurement Range | 1V to 200V (1-2-5 step) |
| Input Terminals and Models | Insulated BNC connector, insulated unbalanced input, isolation between each channel |
| Input Impedance | 1MΩ |
| Low-Pass Filter | 3, 30, 300, 3k, OFF |
| Maximum Rated Voltage To Earth | AC, DC300V |
| No of Channels | 2 |
| Input Coupling | AC, DC, and GND coupling |
| Maximum Sampling Speed | 20MS/s |
| Frequency Response (-3dB) | DC to 5MHz |
| A/D Resolution | 14bit |
| Range Accuracy | ±0.5% of RANGE *After offset cancellation |
| Allowable Input Voltage | ±500V (DC or AC peak values) |
| Measurement Range | 100mV to 500V (1-2-5 step) |
| Input Terminals and Models | Insulated BNC connector, insulated unbalanced input, isolation between each channel |
| Input Impedance | 1MΩ |
| Low-Pass Filter | 5, 50k, 500k, OFF |
| Maximum Rated Voltage To Earth | AC, DC300V |
| No of Channels | 2 |
| Maximum Sampling Speed | 1kS/s |
| A/D Resolution | 16bit |
| Minimum Resolution | 0.1°C for the thermocouple and 0.01°C for RTD |
| Thermocouple Types | K, E, J, T, N, R, S, B, C |
| RTD Types | Pt100, Pt1000 |
| Range Accuracy | ± (0.1% of RANGE + 1°C) *When 0°C or higher and using K, E, J, T, or N |
| Cold Connection Point Compensation Accuracy | ±1℃ |
| Input Terminals and Models | Spring type terminal block, insulated unbalanced input, isolation between each channel |
| Maximum Rated Voltage To Earth | AC, DC300V |
| Bit | 16bit |
| Maximum Sampling Speed | 1MS/s |
| Input Type | Voltage or contact, isolated input, no insulation between channels |
| Input Voltage Range | 0~24V |
| Input Response Time | 1μs |
| Input Terminal | 8ch square connector x 2 ports |
| Notes | Input by an optional IC clip or electrical clip code |
| Features | Start /Stop by external signal, mark print, paper-feed, external sample Input of external trigger signal, trigger signal output Synchronous digital signal for AC distortion module |