RT-View
A simple to use real time analysis tool for the TEAC VR-24 data recorder.
Manufacturer: TEAC Europe GmbH
Call for price
Description
RT-View Real-time Analysis for VR-24 from TEAC.
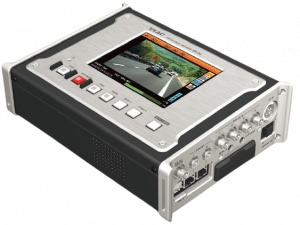
RT-View is a simple to use real time analysis tool for the TEAC VR-24 data recorder.
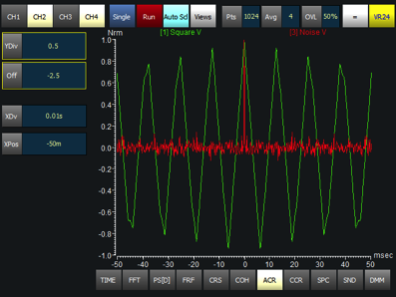
While the VR-24 is recording data in the background RT-View displays the incoming data in several modes. It allows various trigger options. Eight cursors and advanced zoom methods are supported. Any calculation, display setting or number of views can be altered in real time. RT-View uses a simple human interface (optimized for touch panels) without nested dialogs. In nearly all cases RT-View uses one button for one function. The Auto layout lets you display up to 2 diagrams with selectable functionality.
Product Features
- Easy to use interface
- FFT, Power spectrum, Power spectral density, Frequency response, Cross spectrum, Coherence, Autocorrection, Cross correlation, Spectrogram, Numerical display.
- Up to 8 cursors, with automatic peak detect in some functions. Difference or RMS values between cursors.
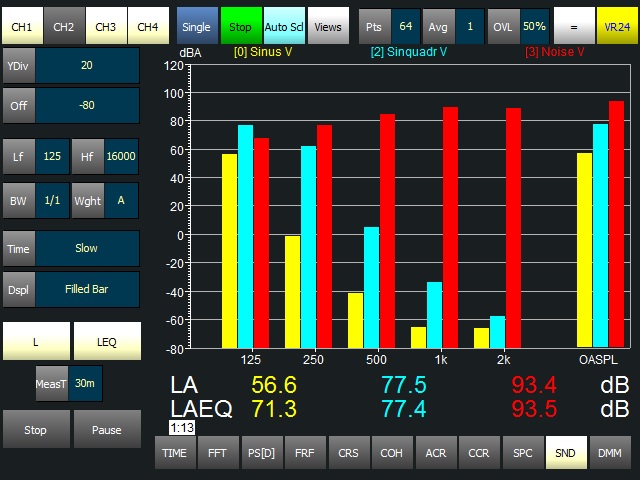
- Octave diagram with A, C and Z weighting, Exponential time filter, L and Leq calculation, Bandwidth 1, 1/3 and 1/6 octave.
- Selectable Windows functions, FFT points, averaging and overlay for frequency functions.
- X-Y zoom with selectable boundaries.
- Time diagram with various trigger modes.
| Real Time Display | |
| Diagram Type | Time diagram / FFT / Power spectrum or Power spectrum density / Frequency response function / Coherence / Auto correlation / Cross correlation / FFT spectrogram / Octave analysis / Digital multi-meter |
| Number of display | 1 / 2 |
| Display Update | Single / Continuous |
| FFT Set up | |
| Number of line | 16 - 65536 (increments of a power of 2) |
| Averaging | 1 - 128 (increments of a power of 2) |
| Overlapping | Between 0 and 75% of FFT the data points (in 25% steps) |
| Window Function | Rectangle / Bartlett / Hanning / Hamming / Blackman / Flat Top / Low Sidelobe |
| Time Diagram | |
| Channel | Max. 4ch (Analog channel only), selectable |
| Coupling | DC / AC |
| Trigger | Non / Auto / Level, define the pre trigger value between 0 - 100% (in 10% steps) of the display area. |
| FFT / Power Spectrum (Density) | |
| Channel | Max. 4ch (Analog channel only), selectable |
| Y-axis | RMS / Peak (only FFT) / dB |
| Averaging | Linear / Peak hold |
| 3D Display | Available |
| Frequency Response Function | |
| Channel | One pair (Analog channel) selectable |
| Y-axis | Linear / dB |
| Calculation Methods | H0 / H1 / H2 |
| Cross Spectrum / Coherence / Cross Correlation | |
| Channel | One pair (Analog channel) selectable |
| Auto Correlation / Spectrogram | |
| Channel | Max. 4ch (Analog channel only), selectable |
| Octave Analysis | |
| Channel | Max. 4ch (Analog channel only), selectable |
| Band width | 1/1, 1/3 |
| Weighting | None / A / C |
| Time Weighting | Slow / Fast / 35 msec |
| Display | L, Leq |
| Digital Multi-meter | |
| Channel | Max. 4ch (Analog channel only), selectable |
| Integration Times | 0.3 / 1 / 3 seconds |
| Display Value | Last value (no calculation) / Mean / RMS / Max / Min |
*This software only provides display function of analysis or calculation results. Values and diagrams are not stored.
Request further information on this product below
You may also like…
Related products
-
DAS240 20 to 200 channel Handheld Universal Datalogger
£2,995.00 – £3,150.00 ex VAT Select options This product has multiple variants. The options may be chosen on the product page -
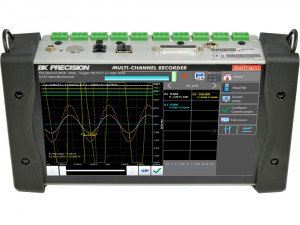
DAS220 10 Ch Handheld Universal Data Logger
£1,525.00 – £1,695.00 ex VAT Select options This product has multiple variants. The options may be chosen on the product page -
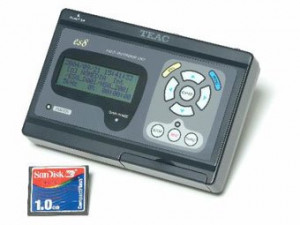
ES8
Call for price Read more -
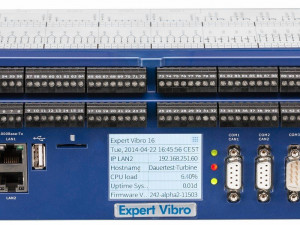
Expert Vibro
Call for price Read more


