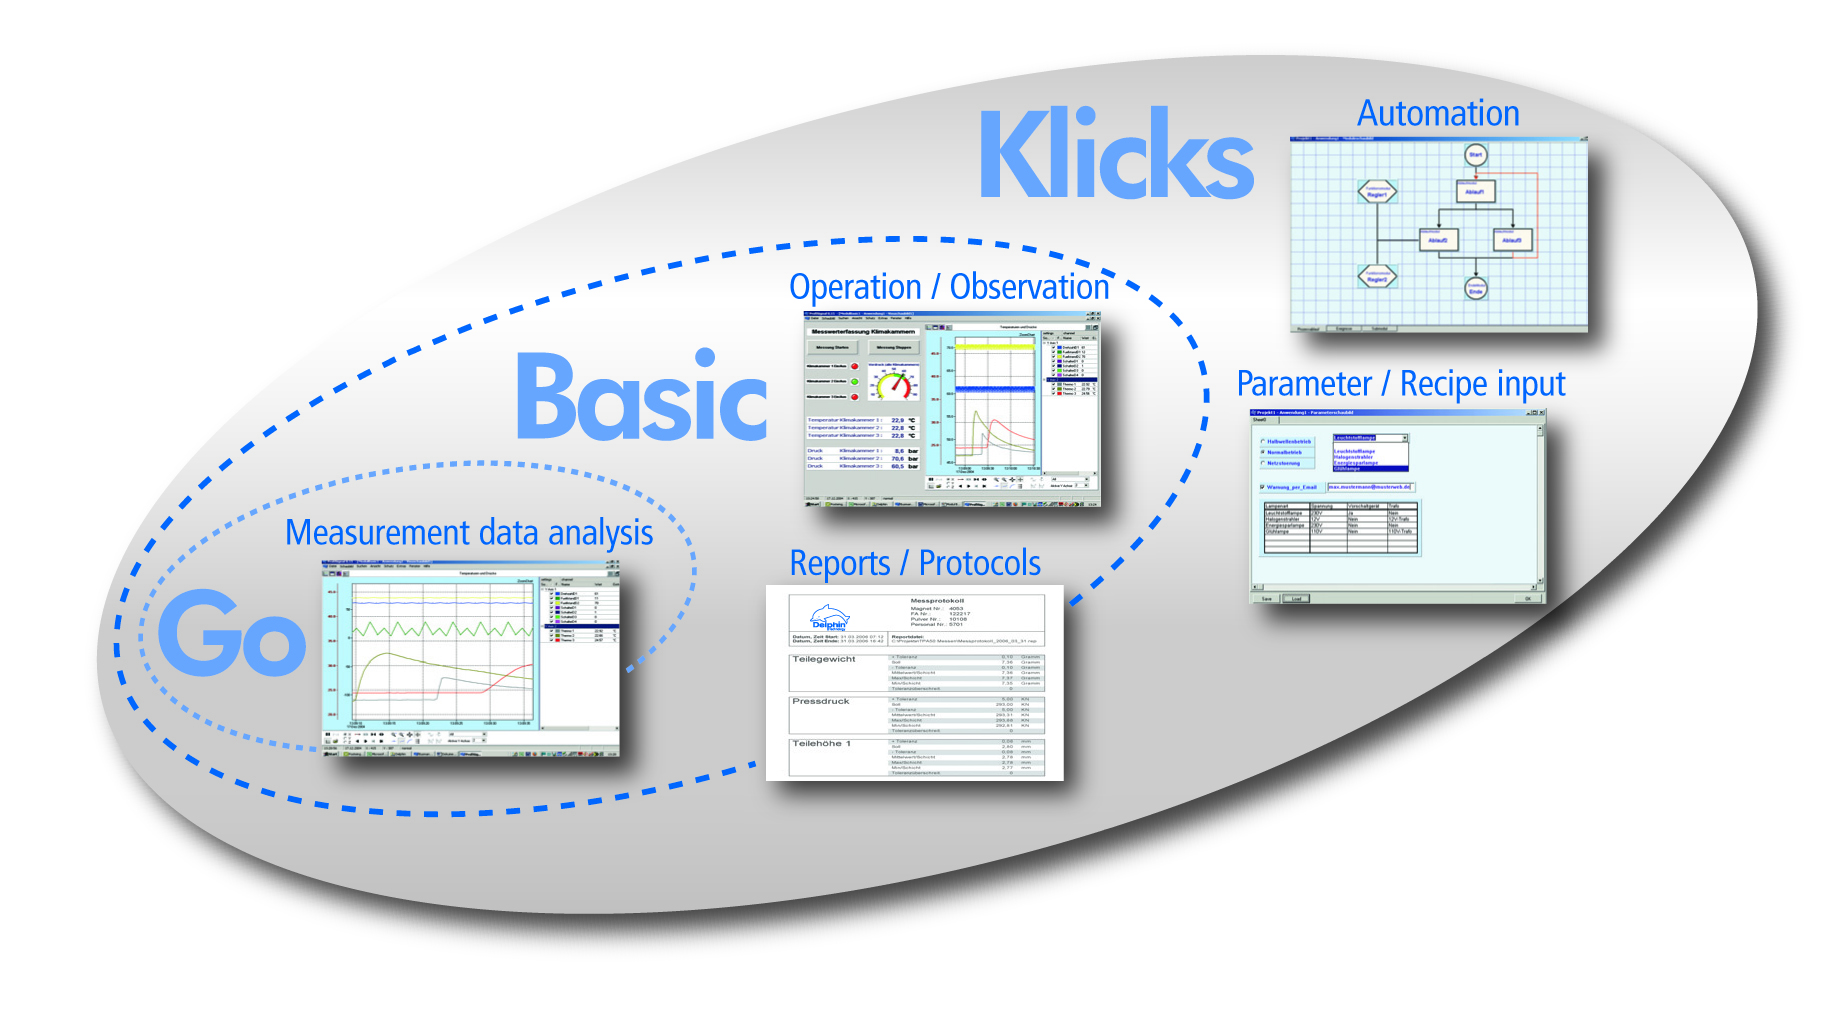


ProfiSignal is a complete software system for data acquisition, analysis, visualisation and automation. The software is also very user-friendly and combines professional functionality with easy operation. ProfiSignal provides a clear and logical overview of all measurement systems: whether for single or multi-thousand channel applications. For new users, ProfiSignal is quick to learn. ProfiSignal is modular, scalable and available in three versions; each version has backward compatibility for operability, data files and application projects:
A runtime system enabling measurement data to be displayed and analysed in just three steps. The GO version is able to analyse large volumes of offline and online data.
Like ProfiSignal Klicks, is a developmental system for generating custom systems with visualization and trend functions
A software for test automation and the programming of control systems
ProfiSignal Basic is a complete software package to meet user requirements in the fields of measurement data acquisition, operation and monitoring. Basic provides ready to use modules for:
ProfiSignal Basic is designed to be fully configurable and compatible for continuous processes (e.g. operational data acquisition) as well as batch processes (e.g. data from experiments and trials). Basic includes basic automation functions for measurement procedures. Basic includes every function from ProfiSignal Go.
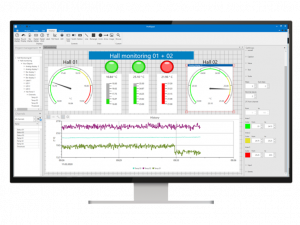
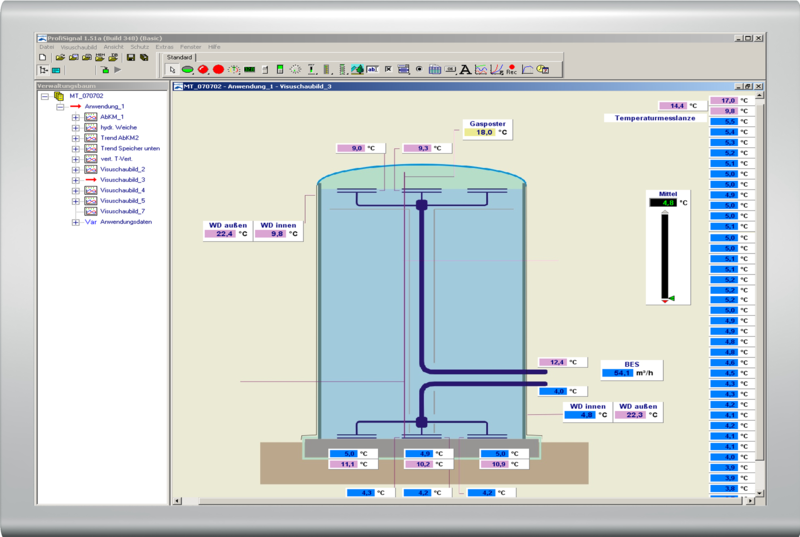
A large range of operation and observation objects enable the simple generation of process visualization diagrams. These are available with analysis functions. Operating and monitoring functions can be organized into viewing images. Even inexperienced users are able to quickly generate their own applications. These are generated in development mode and can then be switched for operation to runtime mode.
The integrated DataService, especially suitable for large amounts of data, enables historical data to be immediately displayed on the screen at high-level resolution. Evaluation can take place from the company network or from anywhere in the world. Measurement data can also be stored over extremely long periods of time. For vibration analysis or for the evaluation of transient events, data can easily be acquired and stored at kHz-sampling-levels. Recorders allow data acquired for specific tasks to be stored in separate files on the PC.
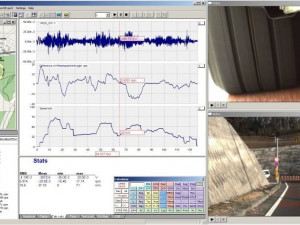
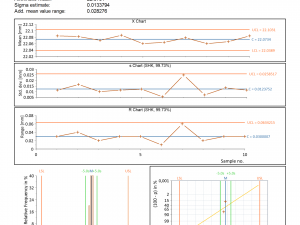
A range of diagrams are also available for measurement data analysis. Y(t) diagrams enable high resolution portrayal of continuous processes over long time periods. This is particularly beneficial for quality assurance and fault diagnostic systems. Both slow and fast signals can be combined in one graph. A formula manager enables online and offline computations of measurement data as well as the recording and portrayal of computed results. Complex efficiency computations as well as basic temperature averages are simple to perform.
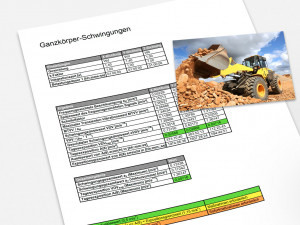
As well as measurement data and computed data, a report may also contain objects such as y(t) diagram (trends), y(x) diagram (characteristic curves), tables, illustrations, input data and text. Reports can be generated and archived automatically according to time or events. This is an ideal tool for quality assurance, quality certification and accounting purposes.
Measurement hardware configuration takes place with the DataService / Configurator software included in ProfiSignal. The software configures hardware and software interfaces and records data securely and permanently.
The DataService saves measurement data to a database. Any ProfiSignal version on the network can then access these databases and immediately display their data as trends.
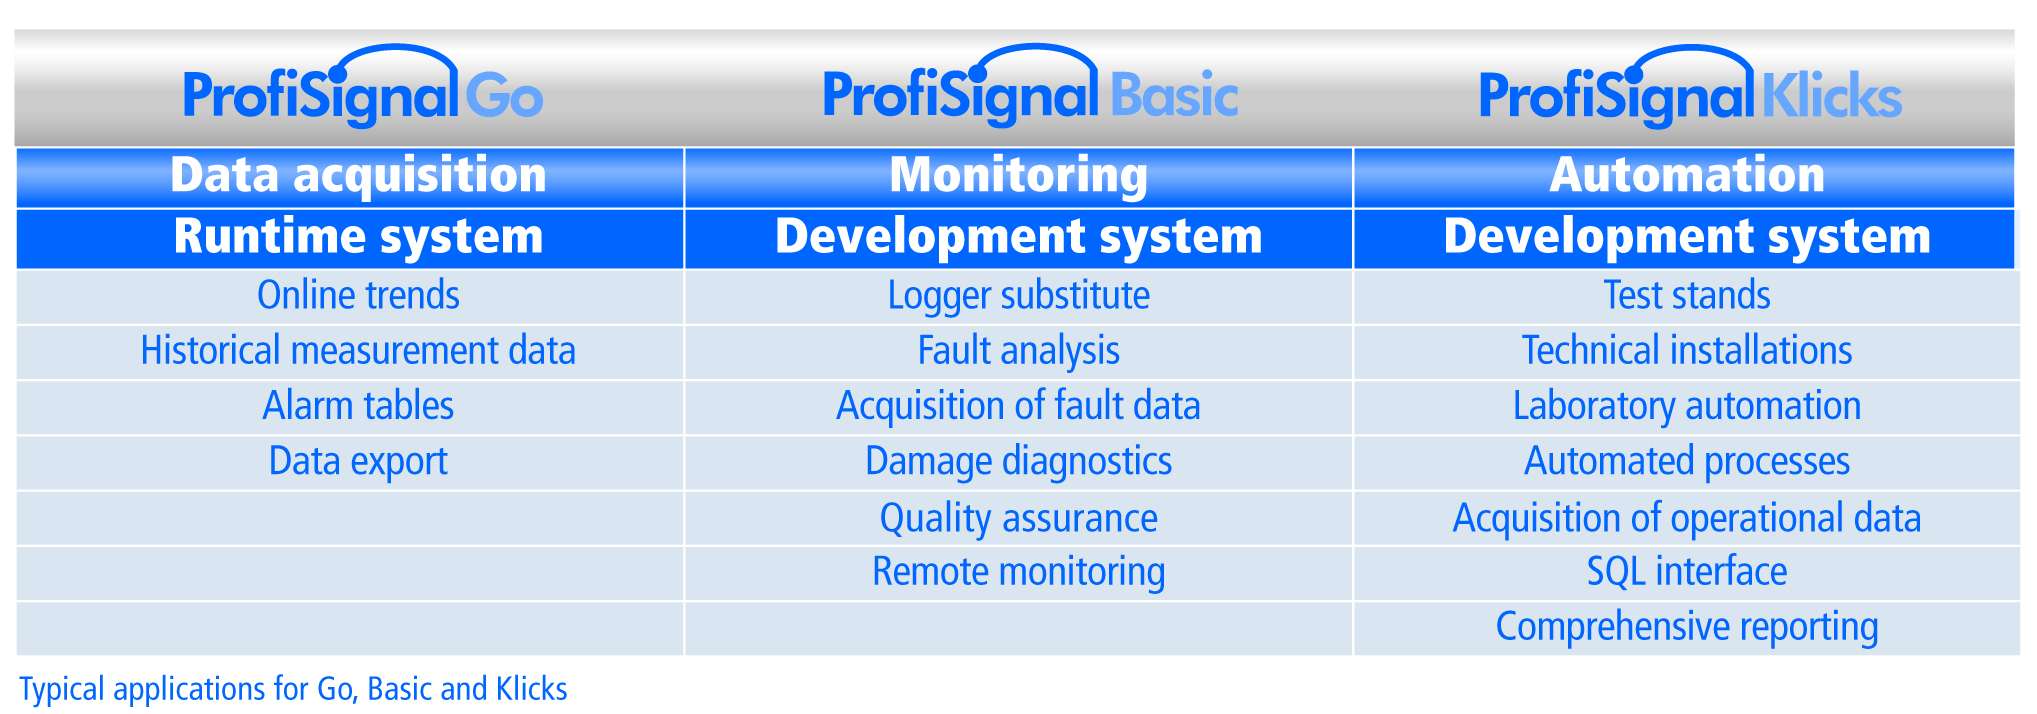
Option / Function |
Go |
Basic |
Klicks |
Diagram types (online und offline) |
|||
| y(t) diagram | x | x | x |
| y(t) bar chart |
x | x | x |
| y(x) (double) diagram | x | x | x |
| y(x) colour diagram | x | x | x |
| y(x) table | x | x | x |
| Bar chart (moving)* | x | x | x |
| Logic diagram | x | x | x |
| Oscilloscope diagram* | x | x | x |
| Graphic export in EMF format | x | x | x |
| Data export in ASCII and CSV formats | x | x | x |
| Data export in WAV format** | x | x | x |
| Data export in diadem format*** | x | x | x |
| Recorder function | x | x | x |
| Profile editor / procedure | x | x | x |
| Sequence editor / procedure | x | x | x |
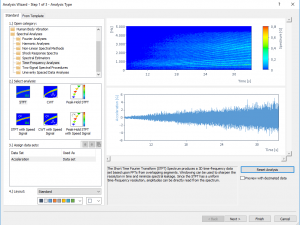
| FFT and FFT-cascade diagram | Vibro | Vibro | Vibro |
| Orbit diagram | Vibro | Vibro | Vibro |
| Spectrogram | Vibro | Vibro | Vibro |
| Bode diagram | Vibro | Vibro | Vibro |
| Polar diagram | Vibro | Vibro | Vibro |
| Shaft-centerline diagram | Vibro | Vibro | Vibro |
| AirGap bar chart* | Vibro | Vibro | Vibro |
| AirGap polar-profil diagram* | Vibro | Vibro | Vibro |
| AirGap concentricity diagram* | Vibro | Vibro | Vibro |
Graphical display elements |
|||
| Digital display | x | x | |
| Analog round display 120°/180°/270° | x | x | |
| Analog display (vertical and horizontal) | x | x | |
| Bar display (vertical and horizontal) | x | x | |
| Tank display / Fill level | x | x | |
| LEDs | x | x | |
| Signal lamp | x | x | |
| Table | limited | x | |
| Wallpapers and animated GIF images | x | x | |
Operating and control instruments |
|||
| Rotary Knob | x | x | |
| Slider (vertical and horizontal) | x | x | |
| Toggle switch | x | x | |
| Slide switch | x | x | |
| Button | x | x | |
| Checkbox | x | x | |
| Text input | x | x | |
| Radio button | x | x | |
| Drop-down/channel drop-down | x | x | |
| Digital clock, stop-watch | x | x | |
Programming and automation |
|||
| Visualisations | x | x | |
| Parameter views | x | ||
| Report generation | limited | x | |
| Process control with structure view | x | ||
| Time/timer and event sequences | x | ||
| Date/time fields | limited | x | |
| Channel selection per project | x | x | |
| Formulary | x | x | |
| Calculation channels | x | x | |
| Adapter channels | x | x | |
| Application variables | x | ||
| Application lists | x | ||
| Application tables (2D and 3D) | x | ||
Further options / functions |
|||
| Data recorder with trigger functions | x | x | x |
| Screenshot functions | x | x | x |
| Setpoint curves | x | x | |
| Offline calculation channels | x | x | x |
| Global alarm table | x | x | x |
| Running projects without development environment | Runtime | Runtime | |
| Configurable alarm tables | Alarm | Alarm | |
| Fault value analysis | Alarm | Alarm | |
| ODBC connection | SQL | ||
| ODBC table | SQL | ||
| ODBC SQL | SQL | ||
Driver |
|||
| API device driver | Option | Option | Option |
| API database driver | Option | Option | Option |
| LabView driver | Option | Option | Option |
| DasyLab driver | Option | Option | Option |
| Terminal server | Option | Option | Option |
*Only Online.
** Only Raw Tracks Expert Vibro/Transient.
*** Not for Spectren.
Notes
Online: Function is available for live data
Offline: Function is available for historical data
Runtime: Separate runtime license required
Vibro: Function included in Vibro option
Alarm: Function included in Alarm Management option
SQL: Function included in SQL option
Option: Optional additional function
Option / Function |
Delphin Data Center ¹ |
DataService ² |
Configurator |
| Compressing data without loss |
x |
x |
|
| Storing and providing data |
x |
x |
|
| Scheduler - Time-managed data transfer |
x |
x |
|
| Sequencer |
x |
x |
|
| Calculation and monitoring channels |
x |
x |
|
| Software channels |
x |
x |
|
| Simulation channels (sinus, triangle, rectangle, sawtooth) |
x |
x |
|
| User management |
x |
x |
|
| Alarm management |
x |
x |
|
| Interface management |
x |
x |
|
| Option OPC client* |
x |
x |
|
| Option OPC server** |
x |
x |
|
| Audit trail option*** |
x |
x |
|
| Network access |
x |
|
|
| Device configuration |
|
|
x |
* OPC DA client interface. From autumn 2020 also OPC UA client interface.
** OPC DA server interface.
*** Not in conjunction with ProfiSignal Web.
Notes
¹Delphin Data Center Central provision of functions on a PC or server. Access by multiple clients also possible from other computers
via network.
²DataService Local provision of functions. Single user license without network access.
Microsoft Windows from version 7 (32- / 64-bit)*
Microsoft Windows Server from version 2008 R2 (32- / 64-bit)*
Microsoft Windows from version 7 (64-bit)*
Microsoft Windows Server from version 2008 R2 (64-bit)*
* Up to the version that is current at the time of release.
At least 2 GB. Recommended: 3 GB for 32-bit systems, 8 GB for 64-bit systems
A PC with at least a 2 core processor from the 2.5 GHz class. Recommended: System with 4-core processor from 3.5 GHz
>4 GB
At least 1024 x 768 resolution, fixed font size 96 dpi (100 %)
Tested browser version for ProfiSignal Web Clients
Browser |
Version |
Operating System |
| Google Chrome | 68.0.3440.106 (64-bit) | PC, Windows 10 Pro 1803 |
| Firefox | 61.0.2 | PC, Windows 10 Pro 1803 |
| Microsoft Edge | 42.17134.1.0 | PC, Windows 10 Pro 1803 |
| Safari | - | iPad Simulator, iPad Pro iOS 11.4 |
| Safari | - | iPad Pro iOS 11.4.1 |
| Opera | 55.0.2994.37 | PC, Windows 10 Pro 1803 |
Registered: 09.04.2020