ProfiSignal 20 Go
A quick solution to visualising online and offline measurement data in a variety of diagrams.
SKU
ProfiSignal 20 Go
Category Data Acquisition Software
Tags Delphin Data Acquisition Software, ProfiSignal 20
Manufacturer: Delphin Technology AG
Call for price
Description
ProfiSignal 20 is a complete software package for use in data acquisition and analysis, visualisation and process control. It is highly user friendly and combines versatile functionality with first-class usability.
ProfiSignal 20 is logically structured and easy to understand regardless of whether you are processing just a few or a few thousand channels. If you are already familiar with the well-known measurement technology software ProfiSignal, then you can look forward to familiar and proven functions in a new look. Many new functions are also included as well as advanced platform independence.
If ProfiSignal is new to you, its intuitive operation and optimal user experience will enable you to quickly become familiar with the software.
ProfiSignal 20 is a measurement software that you can use on a desktop PC in your office as well in a control centre’s measuring system. ProfiSignal 20 is platform independent so it can also be used on tablets and smartphones. With its innovative options, ProfiSignal 20 can considerably simplify your work, while also saving lots of time.
ProfiSignal 20 is modular, scalable and is available in two versions:
- ProfiSignal 20 Go takes you from measurement data to detailed graphical portrayals in just a few clicks.
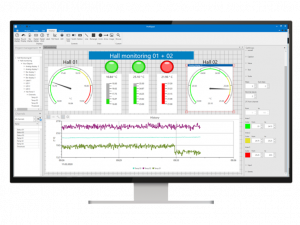
- ProfiSignal 20 Basic lets you create sophisticated and detailed visualisations of installations and processes while also enabling easy process control.
ProfiSignal 20 Go
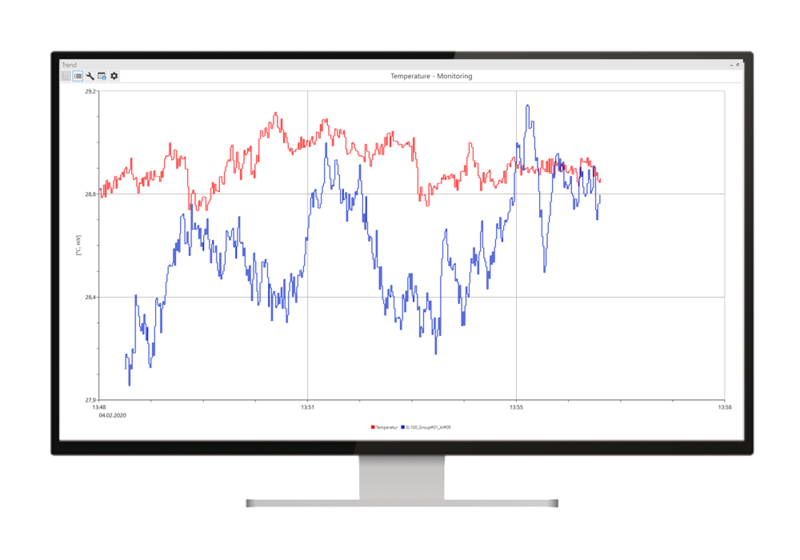
ProfiSignal 20 Go provides a quick solution to visualising online and offline measurement data in a variety of diagrams. It allows you to monitor, analyse and archive data, as well as export in the required format. Historical measurement data can be accessed during ongoing measuring processes to enable comparisons with the actual data. Different types of statistical functions can be used to mark and directly analyse specific data ranges. A recorder function simplifies trials and experiments enabling direct comparisons between different experimental procedures. The recorder can also be used in batch processing. It creates a measurement data file which can also be sent by email for further evaluation.
Product Features
- Multi-track diagrams for linking several diagrams on the same time axis, e.g. to directly compare analog and digital signals
- SCACH function – one scan is sufficient to open the correct diagram
- Just a few clicks are required to go from measurement data to graphical portrayal
- Monitoring and analysis of any measurement data from different sources (hardware and software)
- Single and multi-axle y(t) diagrams with the option for simultaneous display and analysis of different measured variables
- Statistical evaluation and on- and offline calculation functions
- Smooth zoom function from full overviews to high-resolution μ-seconds ranges
- Data export in CSV, Diadem or WAV formats
- Simplified performance of trials/experiments and batch processes with the user-friendly recorder function
Software Comparison
Option / Function |
ProfiSignal 20 Go |
ProfiSignal 20 Basic |
Diagram types and functions (online and offline) |
||
| y(t) diagram | Ο | Ο |
| Any number of y-axes, left or right positioning | Ο | Ο |
| Scalable y-axes: linear, relative or logarithmic | Ο | Ο |
| Time axis, above or below positioning | Ο | Ο |
| Automatic axis labelling | Ο | Ο |
| Display modes: points, steps, lines, interpolated | Ο | Ο |
| Platform-optimised zoom functions | Ο | Ο |
| y(x) diagram | Ο | Ο |
| Multi-track diagram | Ο | Ο |
| Recorder function | Ο | Ο |
| Loading/saving measurement files | Ο | Ο |
| Accessing database/device memory | Ο | Ο |
| Statistical functions on live and historical data | Ο | Ο |
| Diagram export as graphics file | Ο | Ο |
| Diagram printing function | Ο | Ο |
| Data export in ASCII and CSV formats | Ο | Ο |
| Data export in WAV format* | Ο | Ο |
| Data export in Diadem format | Ο | Ο |
| Load/save diagram configuration | Ο | Ο |
Operation and Control Instruments |
||
| Input field | Ο | |
| Slide switch | Ο | |
| Button | Ο | |
Display and Graphical Elements |
||
| Analog display | Ο | |
| Round display | Ο | |
| Bar display | Ο | |
| Digital display | Ο | |
| Labelling | Ο | |
| LED | Ο | |
| Image object | Ο | |
| Background image | Ο | |
| Geometric objects (lines, rectangles, circles, arrows) | Ο | |
Other Options / Functions |
||
| SCACH function for instant access to projects and diagrams | Ο | Ο |
| Project variants optimised according to platform | Ο | |
| Working-copy function: editing active projects | Ο | |
| Creation of background images via camera function | Ο | |
| Object designer for combining objects | Ο | |
| Setting object properties from channel values | Ο | |
| Different themes: "Dark", "Light", "Colourful" | Ο | Ο |
| Beginner and expert modes | Ο | Ο |
System Requirements |
||
| Windows | Minimum version: Windows 10 64-bit, Min. 4 GB RAM | |
| Mobile | Minimum iOS version: 12.0 Minimum Android version: Android 8 (Oreo) |
|
* Only Raw Tracks Expert Vibro / Transient

