WinDaq Data Acquisition Recording & Playback Software
SKU
WinDaq
Category Data Acquisition Software
Manufacturer: DATAQ Instruments Inc.
Call for price
Description
WinDaq Recording & Playback Software.
Included FREE with most DI-Series data acquisition Hardware. Installs drivers and WinDaq recording and playback software. Optional Add-on software available.
Product Features
- Supports most DI-Series data acquisition hardware
- Disk streaming and real time display at the hardware rate (Check hardware page for supported sampling rates)
- Built-in Export-to-Excel Function
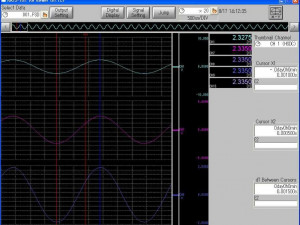
- Cursor-based Waveform Analytical Tools
- Ready-to-run, No programming User Interface
- Purchase higher sample rates or channels
WinDaq has two Applications:
WinDaq Recording Software
– offers a real-time recording with a zero-delay, real-time display with simultaneous data recording to disk.
- Easy Set Up
enter the channels you want to acquire. Select from gain, signal averaging, true RMS, frequency, and peak or valley detection per channel. Define a single to 32-channel display — either triggered sweep (oscilloscope-like) or scrolling (chart recorder-like). Define a sample rate. - Record a continuous waveform, or use the triggered mode with selectable trigger level, slope, and pre- and post-trigger times.
WinDaq automatically time- and date-stamps, then streams acquired data to disk. - Up to 32 channels can be displayed at once. Each channel can be scaled into meaningful engineering units, such as such as psi, °C, amps, rpm, watts, horsepower, etc. You can record waveform data to disk in the background while running any combination of programs in the foreground. (Acquisition speeds and some features vary with data acquisition hardware, so refer to the hardware page for details.)
- Annotation.
Label channels and apply comments to event markers while you record. For example: “Beginning test phase 1,” “Small vibrations noticed,” “Starting cool-down cycle,” etc.
WinDaq Playback (or WinDaq Waveform Browser WWB) Software
– offers an easy way to review and analyse waveform data acquired by WinDaq Recording software.
- Playback’s disk streaming design allows data files of any length to be quickly plotted on your computer.
Compress an entire recording to one screen-width for a bird’s eye view, then expand around an area of interest for a closer look. Use the cursor to measure amplitudes and timing with precision. Move to any event marker with the click of a mouse button. - Built-in analysis functions.
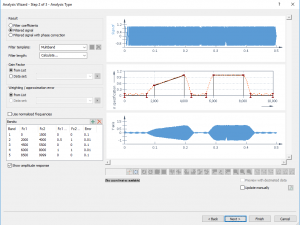
Apply frequency and filtering analysis with the FFT and DFT functions. Analyse any range of waveform data with the statistics function. Use X-Y plotting to examine the relationship of one channel to another. Extended analysis functions allow waveform peak detection, integration, differentiation, arithmetic operations, and more. - Export Data.
Free Excel export from Playback software. You can even copy a graphical image displayed by the WinDaq Playback software and paste it directly into a word processing document. (Optional Live stream to Excel with WinDaq/XL – requires UNLOCK Code)
Optional Add-on software available.
WinDaq Operating System Compatibility*
Unless otherwise noted in product-specific information, WinDaq recording and Playback software is compatible with the following operating systems:
- Windows 7 (32- and 64-bit)
- Windows 8 (32- and 64-bit)
- Windows 8.1 (32- and 64-bit)
- Windows 10 and higher (32- and 64-bit)
Disk and Display (Recording/Acquisition Software) |
|
| Maximum continuous throughput to disk: | Hardware dependent |
| Maximum continuous real-time display throughput: | Hardware dependent |
| Waveform Display Modes: | Continuous smooth-scrolling; freeze; triggered and non-triggered sweep. Dot-joined at all sample rates. |
| Display Trigger Conditions: | Selectable ±slope, level, and source. |
| Waveform Compression: | Allows display rate to vary independently of sample rate. Compression factors of 1 (no com-pression) to 9,000. |
| Number of displayed channels: | 1 to 32 |
| Number of acquired channels: | 1 to 240 |
| Display formats: | Overlapping (2 channel max) and non-overlapping. |
| Maximum Data File Size: | 4GB |
Waveform Display Scaling (Recording/Acquisition Software) |
|
| Screen scaling: | Waveform expansion, contraction, and offset per channel. |
| Engineering Units Conversion: | Scale and offset applied to each channel as y=mx+b. |
| Software selection of: | Amplifier gain and input configuration (for hardware products supporting programmable gain). |
| Grid Scaling: | Allows each displayed channel to be scaled between user-defined limits. |
Hard Copy (Recording/Acquisition Software) |
|
| Hard Copy: | Supports print screen hard copy in the background regardless of disk streaming activity. |
Event Marker and Time and Date Stamp (Recording/Acquisition Software) |
|
| Event Marker Operating Modes: | Asynchronous manual or remote activation with or without comments. |
| Maximum number of commented event markers per file: | 8,184 |
| Time and Data Stamping: | Automatic for acquired data and event markers. |
Programmability (Recording/Acquisition Software) |
|
| Hardware-dependent software selection of: | Amplifier gain, unipolar or bipolar, single-ended, differential, or thermocouple per channel. |
Data Storage Format (Recording/Acquisition Software) |
|
| Format: | 16-bit, 2’s complement binary data with header and trailer information. |
Toolbox (Recording/Acquisition Software) |
|
| Toolbox: | Provides a toolbox of icons used to make setup fast and virtually effortless and to otherwise customize a recording session. |
Waveform Search Feature (Playback Software) |
|
| Search: | Allows you to immediately go to a specific part of the data file based on range or date and time. Specify a range of data for the search and immediately jump to the next or previous data point occurring inside or outside the range. Specify a time and/or date and immediately jump to that position in the file. |
Analogue Waveform Playback (Playback Software) |
|
| Playback: | Allows you to output previously recorded data in analogue form to a speaker, LED, chart recorder, etc. for all hardware products supporting a printer port interface. |
Waveform Display (Playback Software) |
|
| Number of displayed channels: | 1 to 29 |
| Number of supported channels: | 240 |
| Display formats: | Overlapping and non-overlapping |
| Compression: | Allows compressed view of displayed waveforms with compression factors of 1 (no compression) to whatever factor is required to compress the waveform to one screen-width. |
| Display Modes: | Y vs. t; frequency vs. amplitude. |
| Event Marker Display: | Displays event marker number, time and date of activation, and supplied comment in special display window (applies only to waveforms recorded with WINDAQ). |
Waveform Measurement (Playback Software) |
|
| Single-point cursor-oriented measurements (Y vs. t): | Amplitude measurements per channel in calibrated units; elapsed time; time and date at cursor (applies only to waveforms recorded with WINDAQ). |
| Dual-point cursor-oriented measurements (Y vs. t): | Time measurements on the same or across different channels; D%; Y-value difference; two-point slope (d/dt); number of samples; Hz; cycles per minute. |
| Cursor-Oriented measurements (freq. vs. amplitude): | Frequency vs. db; Frequency vs. magnitude (in engineering units). |
Waveform Analysis (Playback Software) |
|
| Statistical Calculations: | Min; max; standard deviation; mean; median; sum; sum-of-squares; skewness; rms; least squares differential; area bounded by curve. |
| Statistical calculation range: | Unlimited |
| Fourier transform calculation ranges: | 32 to 16,384 points (FFT) 2 to 8,191 points (DFT) |
| Selectable FFT windows: | sin2; Hamming; Bartlett; Blackman. |
| Inverse Fourier Transform Range: | 2 to 16,384 points. Time domain waveforms are inserted into display windows as calculated channels. |
| X-Y plotting calculations: | Area bounded by curve; instantaneous rate of change; 2-point rate of change; regression rate of change; max X and Y excursions; time measurements on the same or across channels; amplitude measurements per channel in calibrated units; elapsed time; time and date at cursor. |
File Management (Playback Software) |
|
| Maximum data file size: | Unlimited |
| Supported data file export translators: | WINDAQ (CODAS) format to any spreadsheet (CSV), DADiSP, general purpose binary, and ASCII. |
| Supported data file import translators: | Any spreadsheet (CSV), DADiSP, CODAS, ASCII, and binary integer/real to WINDAQ(CODAS) format. |
| Data file translator range: | Unlimited |
| Data file format: | 16-bit binary with data file header and trailer. |
Waveform Hard Copy (Playback Software) |
|
| Type: | Print screens and continuous form. |
| Continuous form hard copy: | Generates an unlimited length of continuous hard copy of any combination of channels. |
| Supported printers: | Any supported by Windows. |
| Supported printer resolution: | Printer-dependent. |
* Operating systems no longer supported by Microsoft are not targeted platforms for WinDaq software. While such operating systems should still support WinDaq software, unpredictable problems may occur that will not be considered by DATAQ Instruments to be a failure of the software to perform. Further, no hardware products released after an operating system is discontinued by Microsoft will support the discontinued operating system. If you have any questions regarding compatibility of specific DATAQ Instruments hardware and operating systems, please contact us for clarification.


